What Google PageSpeed Insights Actually Measures
PageSpeed Insights is Google's free website speed tool. Paste your URL, click run, get a report.
For most small business owners, that report is intimidating. Green and red bars, words like "Largest Contentful Paint" and "Cumulative Layout Shift," numbers in milliseconds. Most people just look at the headline score, then either celebrate or panic.
This post is the plain-language version of what's actually in that report, what matters, and what doesn't. By the end of it you should be able to read your own PageSpeed report and know what to focus on.
Run pagespeed.web.dev with your homepage URL in another tab if you want to follow along.
What PageSpeed Insights Actually Tests
The tool does two things:
- Field data: real performance from real Chrome users who visited your site recently (when there's enough traffic)
- Lab data: a single simulated test that PageSpeed runs right now from Google's servers
Field data matters more, because it reflects what your actual customers experience. Lab data is useful for debugging because it's reproducible.
For most small business sites, field data isn't available because there aren't enough visits to generate the sample. In that case, you only see lab data, and that's still useful.
The Three Core Web Vitals
The three metrics Google actually weights for ranking.
Largest Contentful Paint (LCP)
What it measures: how quickly the main visible content of your page appears.
The threshold: under 2.5 seconds is good. 2.5 to 4.0 is "needs improvement." Above 4.0 is poor.
What slows it down: large images, slow servers, render-blocking scripts.
Interaction to Next Paint (INP)
What it measures: how quickly the page responds when users tap or click.
The threshold: under 200 milliseconds is good. 200 to 500 is "needs improvement." Above 500 is poor.
What slows it down: heavy JavaScript, long-running scripts blocking the main thread.
Cumulative Layout Shift (CLS)
What it measures: how much content jumps around as the page loads.
The threshold: under 0.1 is good. 0.1 to 0.25 is "needs improvement." Above 0.25 is poor.
What causes it: images without specified dimensions, fonts swapping mid-load, ads or embeds appearing late.
If all three are green, your Core Web Vitals are passing. Google says this affects ranking.
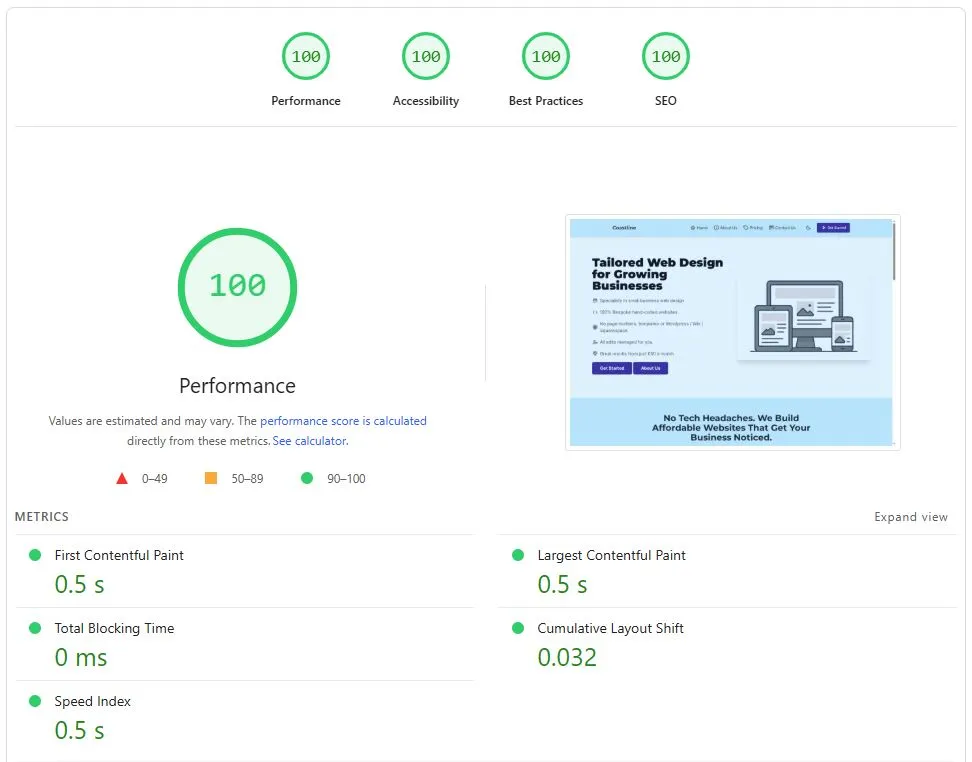
The Headline Score
Above the Core Web Vitals, you see a big number (the PageSpeed score). It runs from 0 to 100.
- 90 to 100: green, "fast"
- 50 to 89: amber, "moderate"
- 0 to 49: red, "slow"
This score is a weighted blend of several lab metrics: LCP, Total Blocking Time, CLS, First Contentful Paint, and Speed Index. Google's algorithm for the score has changed over the years.
Some details to understand:
- The score is not the same as Core Web Vitals. You can have a 75 score with passing Core Web Vitals, or a 90 score with one failing CWV.
- The score is more sensitive to small changes than CWV bands. A 200ms speed improvement can shift the score by 10 points without changing the green/amber/red CWV outcome.
- Mobile scores are almost always lower than desktop scores. Mobile testing simulates a slower CPU and 4G network.
Lab vs Field Data
The two halves of your report. Understand the difference.
Field data (Chrome User Experience Report):
- Based on real Chrome visits to your site over the previous 28 days
- Only shows if your site has enough traffic (typically 1,000+ visits a month)
- Shows the 75th percentile experience (most visitors had this or better)
- This is what Google uses for ranking
Lab data:
- A single simulated load from Google's testing infrastructure
- Always available, regardless of traffic
- Useful for debugging because it's repeatable
- Not directly used for ranking, but correlates strongly with real-world performance
For sites with low traffic, you'll only see lab data. That's still actionable. Fix the lab issues and your real-world performance usually follows.
If you have field data showing all-green CWVs, you're in good shape regardless of the headline score.
Reading the Diagnostics
Below the headline numbers, PageSpeed Insights lists specific opportunities and diagnostics:
- "Reduce unused JavaScript" (almost always present, usually fixable)
- "Eliminate render-blocking resources" (deferring CSS or JS that doesn't need to load first)
- "Serve images in next-gen formats" (use WebP instead of JPEG)
- "Properly size images" (don't load a 3000px image to display at 300px)
- "Reduce server response times" (TTFB, often a hosting issue)
- "Avoid enormous network payloads" (page is too heavy overall)
- "Use efficient cache policy on static assets" (browser caching settings)
- "Avoid layout shifts" (explicitly size images and ad slots)
Each item shows the estimated time you'd save by fixing it. Items at the top of the list usually have the biggest impact.
Mobile vs Desktop
The default view is desktop. Switch to mobile (the toggle at the top), because mobile is usually:
- Where most small business traffic comes from (typically 60 to 75 percent of UK small business visits)
- Where the worst scores hit (mobile testing simulates a mid-range Android on 4G)
- Where Google primarily ranks you (mobile-first indexing has been default since 2019)
If your desktop score is 95 and your mobile is 52, your real ranking signal is the mobile score. Fix that, and the desktop will look after itself.
Only worry about desktop if your audience is genuinely desktop-heavy. For most small businesses, mobile is the score that matters.
What "Average" Looks Like in 2026
For UK small business websites I audit in 2026:
- Median WordPress site: PSI mobile score of 52, 1 to 2 Core Web Vitals failing
- Median Wix or Squarespace site: PSI mobile score of 65, often passing CWVs
- Well-built hand-coded site: PSI mobile score of 92+, all CWVs passing comfortably
If you're in the median band, you're behind the curve enough that Google notices. If you're in the green band, you're outranking 75 percent of your competition on speed alone.
For background on why this matters commercially, see why website speed matters more than ever.
What Customers Actually Feel
PageSpeed scores measure things customers experience. The translation:
- LCP affects how long the customer waits to see your headline
- INP affects whether tapping a button feels instant or laggy
- CLS affects whether things stay still while they're trying to read
A site with a perfect score feels snappy and confident. A site with poor scores feels broken, even if it eventually loads. Customers don't usually talk about "your LCP." They talk about your site feeling slow or annoying.
A Quick Action Plan
If you've just run PageSpeed Insights and you're below 70 on mobile:
- Check whether field data exists and which CWVs are failing
- Look at the top 3 opportunities in the diagnostics
- Pick the one with the biggest time saving and fix that first
- Re-test, measure the change
- Repeat with the next opportunity
- If you can't get above 70 after 3 rounds, the foundations probably need rebuilding